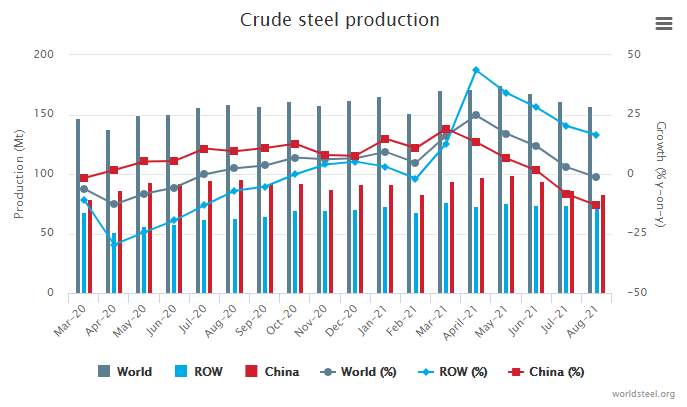
Crude steel production by region
Africa produced 1.3 Mt in August 2021, up 38.2% on August 2020. Asia and Oceania produced 112.7 Mt, down 7.3%. The CIS produced 8.8 Mt, up 3.6%. The EU (27) produced 11.6 Mt, up 27.1%. Europe, Other produced 4.5 Mt, up 11.7%. The Middle East produced 3.6 Mt, up 10.9%. North America produced 10.2 Mt, up 24.4%. South America produced 4.0 Mt, up 17.2%.
| Table 1. Crude steel production by region | |||||
| Aug 2021 (Mt) | % change Aug 21/20 | Jan-Aug 2021 (Mt) | % change Jan-Aug 21/20 | ||
| Africa | 1.3 | 38.2 | 10.6 | 30.3 | |
| Asia and Oceania | 112.7 | -7.3 | 966.3 | 8.5 | |
| CIS | 8.8 | 3.6 | 70.9 | 7.7 | |
| EU (27) | 11.6 | 27.1 | 102.1 | 20.5 | |
| Europe, Other | 4.5 | 11.7 | 33.9 | 15.5 | |
| Middle East | 3.6 | 10.9 | 29.0 | 10.1 | |
| North America | 10.2 | 24.4 | 78.8 | 19.2 | |
| South America | 4.0 | 17.2 | 30.3 | 24.9 | |
| Total 64 countries | 156.8 | -1.4 | 1,321.9 | 10.6 | |
The 64 countries included in this table accounted for approximately 98% of total world crude steel production in 2020. Regions and countries covered by the table:
Top 10 steel-producing countries
China produced 83.2 Mt in August 2021, down 13.2% on August 2020. India produced 9.9 Mt, up 8.2%. Japan produced 7.9 Mt, up 22.9%. The United States produced 7.5 Mt, up 26.8%. Russia is estimated to have produced 6.3 Mt, up 4.4%. South Korea is estimated to have produced 6.1 Mt, up 6.2%. Germany is estimated to have produced 3.0 Mt, up 6.7%. Turkey produced 3.5 Mt, up 7.1%. Brazil produced 3.1 Mt, up 14.1%. Iran is estimated to have produced 2.5 Mt, up 8.7%.
.
| Table 2. Top 10 steel-producing countries | ||||||
| Aug 2021 (Mt) | % change Aug 21/20 | Jan-Aug 2021 (Mt) | % change Jan-Aug 21/20 | |||
| China | 83.2 | -13.2 | 733.0 | 5.3 | ||
| India | 9.9 | 8.2 | 77.7 | 25.6 | ||
| Japan | 7.9 | 22.9 | 64.0 | 17.0 | ||
| United States | 7.5 | 26.8 | 57.1 | 19.5 | ||
| Russia | 6.3 | e | 4.4 | 50.8 | 7.7 | |
| South Korea | 6.1 | e | 6.2 | 47.5 | 8.4 | |
| Germany | 3.0 | e | 6.7 | 26.7 | 17.4 | |
| Turkey | 3.5 | 7.1 | 26.6 | 16.7 | ||
| Brazil | 3.1 | 14.1 | 24.1 | 20.9 | ||
| Iran | 2.5 | e | 8.7 | 20.4 | 9.7 | |
e - estimated. Ranking of top 10 producing countries is based on year-to-date aggregate
 Ensuring Specifications Are Followed in Every Project
 Cooling Staves: Key Considerations for Long-Term Performance
 Welcome 2026!
 Merry Christmas!